
Monitoring in Power Systems Test Bed
The first step to control and monitor the test bed power system is to retrieve measured information of voltages and currents from all points of the grid. This is done through the National Instruments Data Acquisition (DAQ) boards. There are multiple types of DAQs which are being used in the lab. They include USB, Ethernet, Wireless, and PCI modules. Each device has capabilities in different applications. They have different number of input/output ports, digitization precision, rate of sampling and delay in transferring the information.
As an example DAQ-6071 which is a PCI 64 channels analog input is useful for huge number of current and voltages and will be used in monitoring aspects but DAQ-6259 which is a USB 32 channels input analog has less digitization error and higher signal to noise ratio, and faster processor which finally enables better control applications.
Within the test bed grid, there are more than 50 points of interest in the AC grid which the data should be gathered from, and be used for monitoring purposes. Considering each point has 3 phases and measurements on voltages and currents, there will be more than 300 signals which should be gathered and be used for monitoring purposes. This requires using multiple module devices like DAQ-9188 that can handle up to 8 modules and having Ethernet connection, provides network access for different applications by different users.
Here is a picture of the lab showing examples of the data acquisitions and their physical connection

Data Acquisitions and their Physical Connection
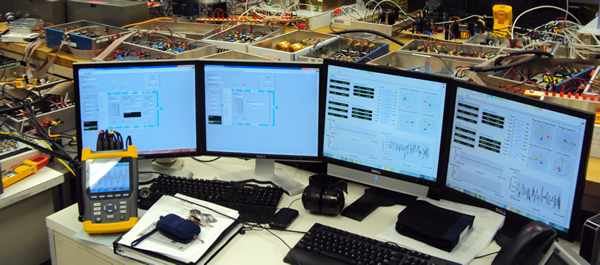
LabView is the software which provides the basis for interface between signals from DAQs and software analysis. It provides good Human Interface Devices (HID) and platforms for calculation/analysis and monitor purposes. Examples of monitored signals for applications in power system monitoring (SCADA) are depicted in these pictures.

LABView interface for Monitoring
The first image shows the monitoring the state of switches and lines for 4 Generators with 8 bus systems which has 20 feeders.The Virtual Interface provides
- Monitoring the state of all 20 breakers (Switches)
- HID to change the state of each breaker
The second image shows the monitoring of single line diagram of 2 Generators with 3 bus system which has 9 feeders.This VI provides
- Monitoring of all 9 feeders active and reactive power in real time
- Controlling the breakers of all 9 feeders
- Access to the details of each feeder through individual interface window (Sub VI)
- Access to generation and synchronizer windows